|
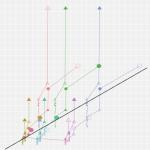
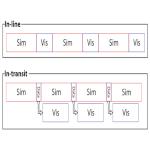
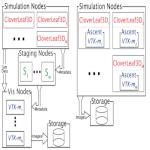
How should in situ processing be scheduled on supercomputers and in what form? This page describes two research directions for in situ processing, first in using cost models and then in optimizing resource configuration. The first research direction focused on ensuring our visualization routines can execute within a time budget specified by a simulation code. A motivation for this problem is that the exact performance of a given visualization routine is often not known beforehand, so it often is not clear if that routine can run within a given budget. Instead, we often are forced to estimate, based on previous anecdotal evidence from similar workloads, extrapolations, etc. Matt Larsen approached this problem by incorporating cost models for rendering use cases, in a publication that was a Best Paper Finalist at SC16. He employed a half-analytical, half-empirical approach to model performance, including a priori knowledge of acceleration structures and fixed costs (e.g., shading) and stratified sampling to cover the parameter space. In the end, he had models for ray-casted volume rendering, and for rasterization and ray tracing of surfaces. Further, after building his model, he used it to ask two interesting questions: (1) for a given a time budget, how many images can be rendered? What if rendering techniques and image sizes are varied? and (2) for a given rendering workload, is rasterization or ray tracing faster? The latter question was particularly timely, since scientific visualization on supercomputers has recently seen a surge of rendering via ray tracing. Matt’s work confirmed that ray tracing is a better choice with smaller images and a large number of triangles, and additionally informed crossover points. Finally, Matt’s models have great potential for in situ scheduling, via adapting a visualization workload to fit the available time (i.e., less/more images, fewer/greater pixels). The second research direction considered how to allocate resources for in situ processing. This question is significant, since in situ processing can take varied forms, and it is not clear which of these forms are best suited for our stakeholders. While much scientific visualization research has focused on "in line" in situ, James Kress has been focused on "in transit" in situ. Roughly, "in line" in this context would mean that the in situ routines are compiled into the simulation code and access the same memory and compute resources, while "in transit" would mean that the in situ routines run as a separate program on distinct resources, with the simulation code transferring its data to the in situ routines, likely over a network. James’s first work in this space was a position paper where he considered ten evaluation criteria between the two variants, including fault tolerance, ease of use, and performance. James's dissertation investigated these criteria further, with a special consideration for performance. The common thinking behind in transit is that it will cost more to use, since an additional allocation must be made for visualization alongside the simulation. But James’s dissertation challenged this thinking. Consider the following. In the in line setting, if a simulation runs with N nodes and visualization takes T1 seconds, then the total cost for visualization (over all nodes) is N x T1. In the in transit setting, an additional M nodes are allocated, and the visualization would run for T2 seconds (total cost M x T2). The key observation is that the in transit allocation will likely have better scalability, because M is likely to be much less than N. As a result, while T2 will almost certainly be greater than T1, T2 x M will almost certainly be less than T1 x N. In words, the total time spent doing visualization can be less for in transit than in line, and this creates an opportunity. For example, if T1 is 3 seconds, N is 1000 nodes, T2 is 12 seconds, and M is 100 nodes, then the cost for in line would be 3000 node-seconds, while the cost for in transit would be 1200 node-seconds. Of course, in transit incurs additional costs, both in transferring data (which can slow down the simulation’s N nodes) and in idle time on the in transit resource’s M nodes, and benefits can only be realized if these costs are less than the speedup (in the previous example, 1800 node-seconds gained). In his first study comparing in line and in transit, James showed that, in some cases, the improved scalability on in transit resources can lead to cost savings overall. Saying it another way, allocating extra resources not only leads to faster execution times (an obvious result), but also can lead to fewer resources used overall (a non-obvious result). In his second study comparing in line and in transit, James took this further, constructing a cost model and evaluating more configurations and visualization algorithms. Finally, in his third study comparing in line and in transit, James shifted away from considering cost and towards considering time-to-solution, and which factors led to the fastest execution time. CDUX People
Publications
|

